I wanted to see the real ransomware in the action, so I got LockerGoga sample from app.any.run. Then I have run exe file with opened ProcessExplorer and ProcessMonitor in the background to see what it will really do on my virtual machine system.
Sample file created another exe file in C:\Users\IEUser\AppData\Local\Temp directory with file name starting from tgytutrc. Then, ProcessMonitor showed me “Process Create” call which started cmd.exe in a way you can see below.
C:\Windows\system32\cmd.exe /c move /y C:\Users\IEUser\playground\malware\LockerGoga.exe C:\Users\IEUser\AppData\Local\Temp\tgytutrc8597.exeInitially, I thought that tgytutrc8597.exe file was unpacked out of original LockerGoga.exe binary, but then I saw this command in action, so it became clear for me why original file – in this case LockerGoga.exe – disappeared. It was just moved to some other place. Below you can also have a look at the function that is responsible for preparing the full path to cmd.exe.
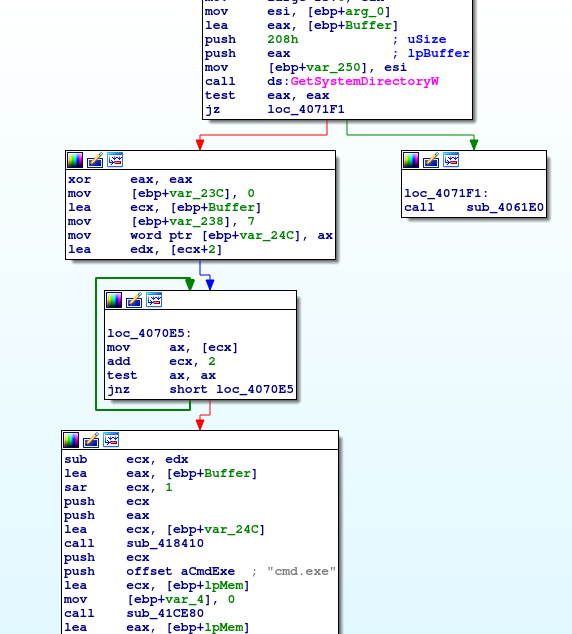
At first GetSystemDirectoryW() which in this case will return C:\Windows\system32 and then path is appended with “cmd.exe” string.
LockerGoga input arguments
Since I was experimenting with the sample I have found out one interesting thing while debugging it. If you start the dropper without any parameters then it will hide in %Temp% directory and start to encrypt your precious files. But if you will start the dropper with “-m” parameter it won’t hide anywhere. It will start its actions within the same place that it is currently stored – move command will be omitted in this case. Still it will encrypt files. Interesting thing is that whenever dropper is called with “-m” option it became parent of child processes run in with different option set “-i SM-tgytutrc -s”. So for most of the time LockerGoga runs 3 processes.
C:\Users\IEUser\playground\malware\LockerGoga.exe -m
        C:\Users\IEUser\playground\malware\LockerGoga.exe -i SM-tgytutrc -s
        C:\Users\IEUser\playground\malware\LockerGoga.exe -i SM-tgytutrc -s
But if you would like to call dropper just with parameters “-i SM-tgytutrc -s” then nothing really happens. Process is being started, checks some system information, query for some registry keys and then it finishes its work. One assumption that came out of this could be that LockerGoga works in two different modes: master and slave one. So if slave does not find its master then it exits.
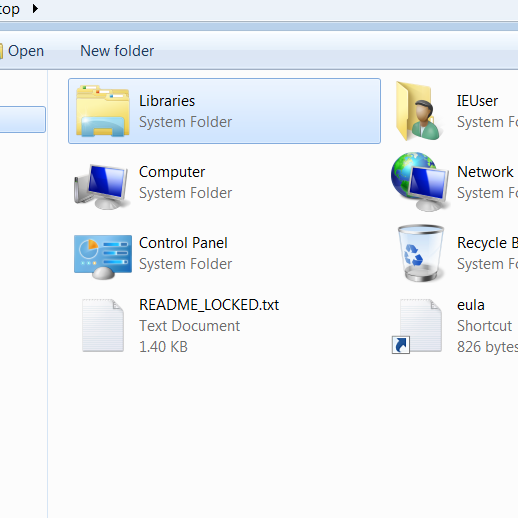
At first let’s called it slave process, creates README_LOCKED.txt file on the Desktop.
While debugging I got to the point that after creating readme file, the slave process exited. Also it seems like the master process is responsible for encrypting files – under ProcessMonitor you can see that master process creates lots of files with extension *.locked. Also watch out while debugging because IsDebuggerPresent() call is checked at the beginning of main thread execution – change the result of this syscall from 1 to 0 in eax register just after the call, it will allow you to debug it the way it should normally work.
Debugging the sample in a master mode lead me to the point that one of the call that eventually creates child processes was not simply call of the static address from process address space – it would be easy to follow the instruction flow in Ida. It was the address within the scope of process address space but to call it processor needed to jump to the address within ESI register. This is probably one of the obfuscation technique used to hide from reversing tools.
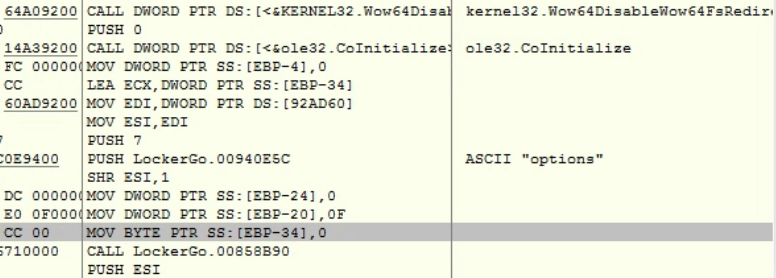
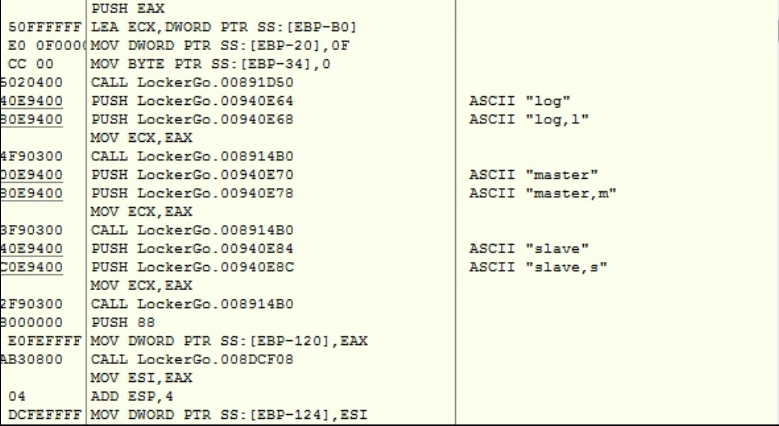
Another thing is that debugging lead me to IMO options parser. Below you can see screens from my OllyDBG window.
Having this in mind and also checking command line parameters of running processes leaded me to the conclusion that those processes works in master-slave manner.
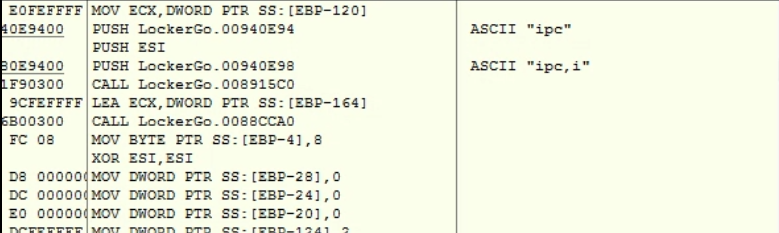
Also I was wondering what “-i” option can be responsible for. It seems like this is for IPC communication – see below screenshot.
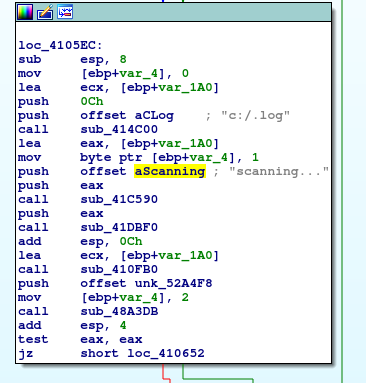
Going back to the log option. While looking for some clues I got through strings in Ida. Guess what was there?
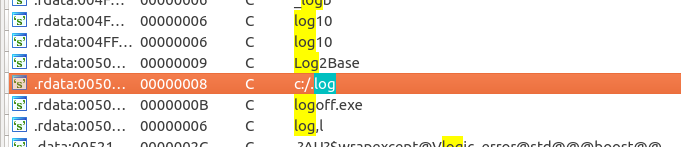
Not to thinking too much I run the dropper with “-m -l” options. And the log file started to being filled with logs related to specific file paths.
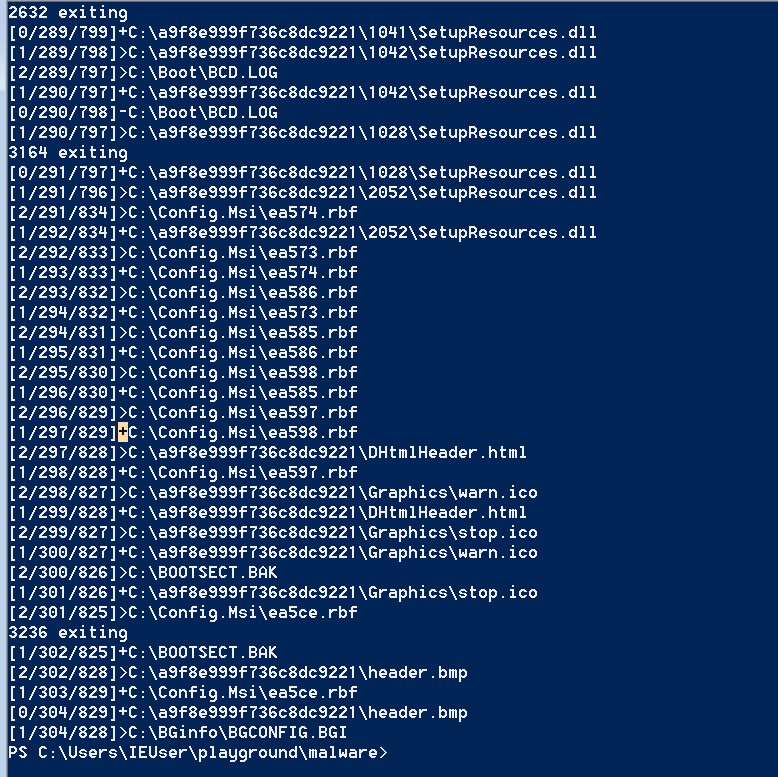
You can see that each slave process is being started, process some files and then exits. Since I found where the logs are stored, then I looked for references to the log, maybe something interesting I would find there? I decided to go to the second xref found by Ida since the first one seems to be very interesting. This leaded me to one huge function with many subroutines. At the end of this there were pretty interesting code block. Let’s have a look at it.
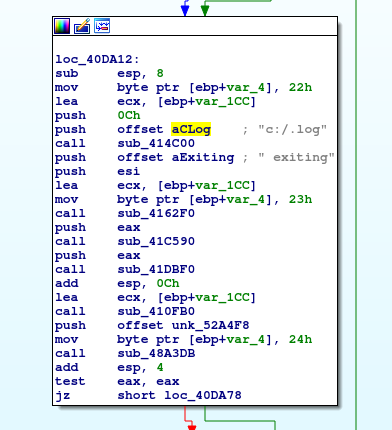
If you will compare with the screen from log output you will see that the line “<ProcId> exiting” seems to be generated by this code block. Since we have logs, it is now more like print-debugging-reversing challenge. The whole function is pretty complicated, I would leave it for now. For me it seems most of the slave code can be found in here.
I would like to get back to the extract log file. Let’s see what it has at its beginning?
scanning...
[1/0/330]>C:\a9f8e999f736c8dc9221\1032\LocalizedData.xml
[2/0/329]>C:\a9f8e999f736c8dc9221\1053\LocalizedData.xml
[1/1/329]+C:\a9f8e999f736c8dc9221\1032\LocalizedData.xml
[2/1/328]>C:\a9f8e999f736c8dc9221\1055\LocalizedData.xml
[1/2/328]+C:\a9f8e999f736c8dc9221\1053\LocalizedData.xml
[2/2/327]>C:\a9f8e999f736c8dc9221\Strings.xml
[1/3/327]+C:\a9f8e999f736c8dc9221\1055\LocalizedData.xml
...
[1/382/2163]>C:\ProgramData\Microsoft\Windows\Caches\{6AF0698E-D558-4F6E-9B3C-3716689AF493}.2.ver0x0000000000000005.db
scan finised
[0/382/2164]-C:\ProgramData\Microsoft\Windows\Caches\{6AF0698E-D558-4F6E-9B3C-3716689AF493}.2.ver0x0000000000000005.db
From my point of view those two strings “scanning…” and “scan finised” could be important in the further analysis(not to mention the type – probably someone was in hurry 😉 ). Let’s find out if I can locate them in Ida.
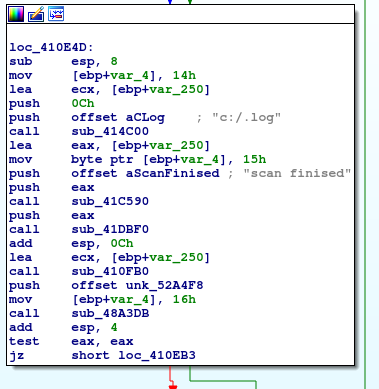
And of course we have another big function which can be analyzed further.
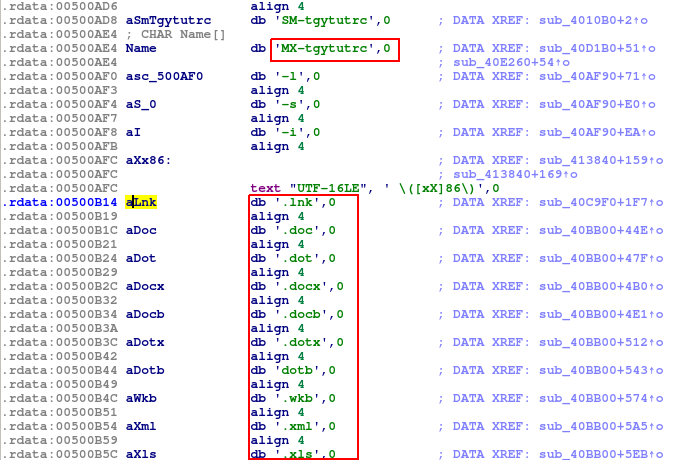
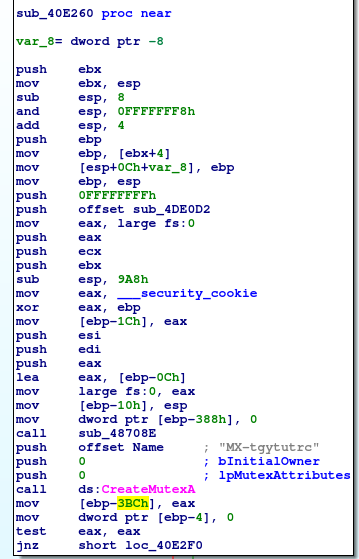
While I wanted to get into details of the function that seems to be responsible for IPC communication(I jumped into the binary segment where string ‘MX-tgytutrc’ was located) which I found very interesting to look into, I have found out list of files extensions – probably the ones that should be encrypted.
Okay. Let’s get back to the function which I think does the IPC communication. It has lots of local variables that are used in the scope of this function.

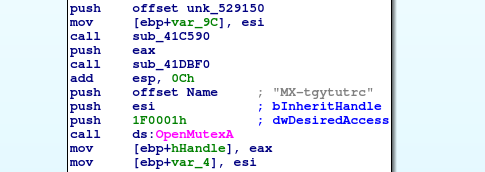
Let’s start to crack that function one piece at a time. At first Ida shows call to OpenMutexA() call.
Since I am not Windows kind of guy, I would need some help from MSDN. There I have found more information about this particular function. Let’s see.
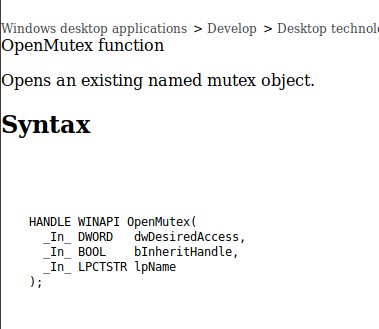
As you can see the function has 3 arguments, desiredAccess, inheritHandle and name. Since this is the stdcall convetion those three argument are passed to the function using the stack in a way that first argument is being put as a last one on the stack. In this case name=”MX-tgytutrc”, inheritHandle=false(since esi register was xored with itself and this will eventually zeroed esi register), desiredAccess=0x1F0001(MUTEX_ALL_ACCESS). Then mutex handle(its address of course) is read from eax register and goes to hHandle local variable.
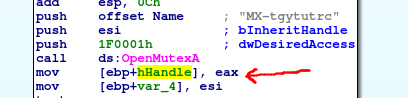
So “MX-tgytutrc” happened to be the name for the mutex object. Then there is some block of code which is hard to analyze without debugger and then hHandle returned by OpenMutex() call is used for as argument to call WaitForSingleObject().
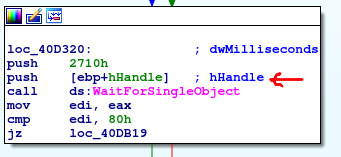
This is another function that I need to check in MSDN.
The time-out interval, in milliseconds. If a nonzero value is specified, the function waits until the object is signaled or the interval elapses. If dwMilliseconds is zero, the function does not enter a wait state if the object is not signaled; it always returns immediately. If dwMilliseconds is INFINITE, the function will return only when the object is signaled.
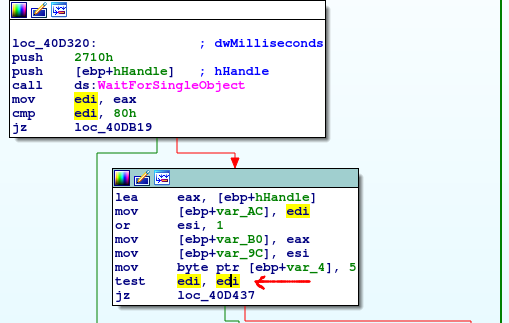
I have bolded the most important part. Thread will wait at most 10s(0x2710 = 10000ms) until mutex object will signal its state. In my own words it would be mutex that is locked and have not been freed within 10s. Then depending of the return value of the WaitForSingleObject() the code will go to the end of the function if 0x80(WAIT_ABANDONED) will be the result of the function all. Next block checks if edi register(where function result is stored) is equal to zero – signal came from mutex object.
The real question is what this mutex is used for? What it is protecting? Let’s go to the place where this mutex is created – this can be easily find looking for another reference of “MX-tgytutrc” string.
I was trying to find out what this mutex is protecting, I have found out that two functions that use this mutex, they are referring to the function that call CreateFileMapping() or OpenFileMapping(). This could be the place where those two processes can use to exchange data between each other. Let’s find out what is it stored in this memory. To easily find it out I will set breakpoint on CreateFileMapping() and OpenFileMapping() calls.
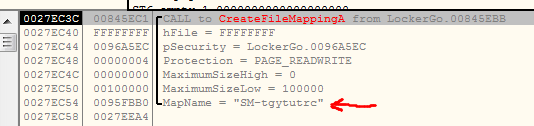
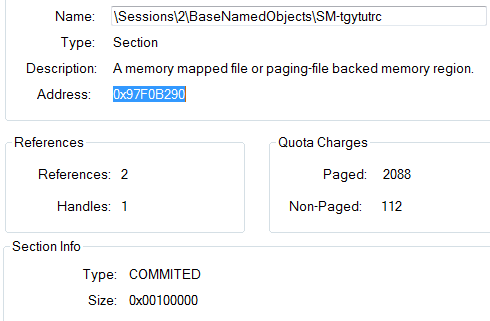
As you can see those are arguments that CreateFileMappingA function has been called with. Especially MapName argument is really interesting. It seems like “SM-tgytutrc” comes from SharedMemory? Let’s wait for OpenFileMapping call and its arguments. Okay. There are so many call to OpenFileMapping that maybe I would need to set conditional breakpoint, but in the meanwhile I got another idea. I tried to look into ProcessExplorer to check if there I can find file mapping. And yes it is. Below you can see how the memory section looks like in ProcessExplorer
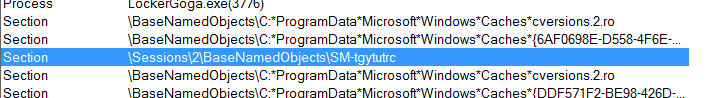
The same section is available in is available in master and also in slave process. So let’s find out what is in there – what those processes are exchanging between each other. I started with some code from MSDN to read memory from share mapping. My file mapping is called ‘SM-tgytutrc’.
#include <windows.h>
#include <stdio.h>
#include <conio.h>
#include <tchar.h>
#define BUF_SIZE 1048576
TCHAR szName[]=TEXT("SM-tgytutrc");

int _tmain()
{
   HANDLE hMapFile;
   LPCTSTR pBuf;
   hMapFile = OpenFileMapping(
                   FILE_MAP_ALL_ACCESS,   // read/write access
                   FALSE,                 // do not inherit the name
                   szName);               // name of mapping object
   if (hMapFile == NULL)
   {
      _tprintf(TEXT("Could not open file mapping object (%d).\n"),
             GetLastError());
      return 1;
   }
   pBuf = (LPTSTR) MapViewOfFile(hMapFile, // handle to map object
               FILE_MAP_ALL_ACCESS,  // read/write permission
               0,
               0,
               BUF_SIZE);
   if (pBuf == NULL)
   {
      _tprintf(TEXT("Could not map view of file (%d).\n"),
             GetLastError());
      CloseHandle(hMapFile);
      return 1;
   }

   char outputBuffer[100000] = {0};
   int j = 0;
   for(int i = 0; i < BUF_SIZE; i++) {
	   if (pBuf[i] != 0) {
		   outputBuffer[j] = pBuf[i];
		   j++;
	   }
   }
   printf("%s", outputBuffer);
   UnmapViewOfFile(pBuf);
   CloseHandle(hMapFile);
   return 0;
}
I got buffer size from the handles view window from ProcessExplorer.
The code just prints all non-zero bytes from this memory mapping file to the console in a string form. The buffer is 1MB so I decided to print only non-zero bytes for now. And here we go, there is something in this memory, some Base64 encoded strings.
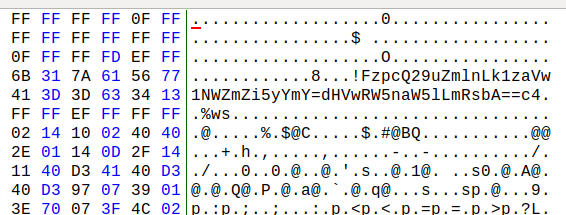
Then I decoded those strings in using python base64 module and this is the output.
>>> base64.b64decode('!FzpcQ29uZmlnLk1zaVw1NWZmZi5yYmY=')
b'\x17:\\Config.Msi\\55fff.rbf'
>>> base64.b64decode('dHVwRW5naW5lLmRsbA==')
b'tupEngine.dll'
So it seems like this is were file paths are exchanged between process. Other decrypted base64 strings shows that these are some files paths, but not only those.
>>> base64.b64decode('QzpcQ29uZmlnLk1zaVw1Njc2YS5yYmY=')
b'C:\\Config.Msi\\5676a.rbf'
>>> base64.b64decode('dHVwRW5naW5lLmRsbA==')
b'tupEngine.dll'
>>> base64.b64decode('c3A=')
b'sp'
>>> base64.b64decode('bWw=')
b'ml'
>>> base64.b64decode('dhVwVWkuZGxsLmRsbA==')
b'v\x15pUi.dll.dll'
>>>
>>> base64.b64decode('c3A=')
b'sp'
>>> base64.b64decode('bWw=')
b'ml'
>>> base64.b64decode('QzpcQ29uZmlnLk1zaVw1NjczYy5yYmY=')
b'C:\\Config.Msi\\5673c.rbf'
>>> base64.b64decode('NDlcZXVsYS5ydGY=')
b'49\\eula.rtf'
>>> base64.b64decode('zpcQ29uZmlnLk1zaVw1Njc5Ny5yYmY==MzNcZXVsYS5ydGY=')
b'\xce\x97\x10\xdb\xdb\x99\x9aY\xcb\x93\\\xdaW\rM\x8d\xceM\xcb\x9c\x98\x99'
>>> base64.b64decode('bXA=')
b'mp'
>>> base64.b64decode('(QzpcQm9vdFxjcy1DWlxib290bWdyLmV4ZS5tdWk=')
b'C:\\Boot\\cs-CZ\\bootmgr.exe.mui'
>>> base64.b64decode('ay5ibXA=')
b'k.bmp'
>>> base64.b64decode('QzpcQ29uZmlnLk1zaVw1NjY3Yy5yYmY=')
b'C:\\Config.Msi\\5667c.rbf'
>>> base64.b64decode('XEFzc2lzdGFuY2VcQ2xpZW50XDEuMFxlbi1VU1xIZWxwX01LV0RfQmVzdEJldC5IMVc=')
b'\\Assistance\\Client\\1.0\\en-US\\Help_MKWD_BestBet.H1W'
>>> base64.b64decode('Ny04RTdGLUJBM0YyNDczMkQ5NX0uSDFR')
b'7-8E7F-BA3F24732D95}.H1Q'
>>>
base64.b64decode('zpcUHJvZ3JhbURhdGFcTWljcm9zb2Z0XE5ldHdvcmtcRG93bmxvYWRlclxxbWdyMS5kYXQ=NzQyLTRkOTYtYTUwYS0xNzc1ZmIxYTdhNDJ9XHByaW50X3F1ZXVlLmljbw==')
b'\xce\x97\x14\x1c\x9b\xd9\xdc\x98[Q\x18]\x18W\x13ZX\xdc\x9b\xdc\xdb\xd9\x9d\x17\x13\x99]\x1d\xdb\xdc\x9a\xd7\x11\x1b\xdd\xdb\x9b\x1b\xd8Y\x19\\\x97\x1c[Y\xdc\x8cK\x99\x18]\x03sC"\xd3FC\x93b\xd6\x13S\x06\x12\xd3\x13ssVf#\x16\x13v\x13C\'\xd5\xc7\x07&\x96\xe7E\xf7\x17VWVR\xe6\x966\xf0'
>>> base64.b64decode('bw==')
b'o'
Then I run LockerGoga sample with “-m” parameter to be run as master process to confirm my hypothesis that master process is exchanging with slaves path to files. Then those files are being encrypted. So I got one of base64 strings stored in memory one more time using my code.

And then I decoded the string.

Seems like another file path. Then I checked ProcessMonitor to look for the process that was using this file.
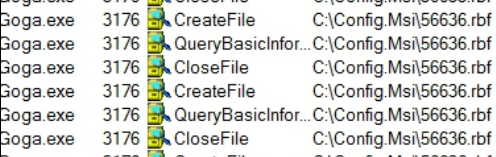
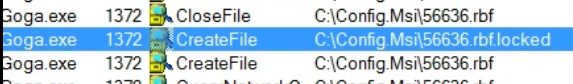
Above screenshots show that the file which path was passed through shared memory was accessed at first by master process(PID 3176) and then slave process(PID 1372) created encrypted version of the mentioned file.
Hope you enjoyed it. There are more and more questions whenever I dig deeper into the code, like how logoff.exe is used, why cipher.exe binary is used there, why the binary is linked against WS_32 library. I try to cover that soon.
Pingback: LockerGoga – networking part and crypto part | malwaredancer